SAS® Statistical Analysis
Below is a collection of SAS® papers on statistical analysis and data mining. For the SAS® programmer with minimum statistical analysis background or experience, this blog serves as a good starting reference to help identify the best to statistical model and SAS®/Stat Procedure to apply based on the type of analysis to perform.
If you are a new statistician, then make sure to review the SAS paper on possible pitfalls of using statistical procedures incorrectly as well as annotated outputs of statistical procs and other annotated outputs. See also PROC FREQ, PROC MEANS/PROC SUMMARY, PROC UNIVARIATE, JMP, PK/PD and New Clinical SAS Programmer. See the new draft Statistical Model Analysis Annotated e-Guide and SAS Syntax. See also free SAS Institute Tutorials on stats and Analysis of Discrete Data course.
See the DO LOOP blog for statistical techniques and ODS Statistical Graphics. See also mind maps 1 and 2.
Basic Descriptive Stats |
Description, FAQ w/ Examples , Simple Stats, Sample Datasets |
|---|---|
| Statistics | Use samples (statistic) to get insights into different populations (parameter), make decisions based on probability |
|
Data Type |
A. Non-Parametric - QUALITATIVE/CATEGORICAL (sex) B. Parametric - QUANTITATIVE/NUMERIC - DISCRETE (yes/no), RANK (grade, pain), or CONTINUOUS (age) Paired Measurements: Change = Post - Pre Percent Change = ((Post - Pre)/Pre) * 100 |
| N | Number of observations in the group |
| Mean |
Meaure of a 'typical value', Sum of all observations divided by total count |
| Median |
Measure of centrality, Order data, midpoint of all data values, low impact from outliers |
| Mode | Maximum frequency |
| Variance | Measure of dispersion - how spread out is the data |
| Standard Deviation |
How much the average data value varies from the mean? Square root of variance.
|
| Standard Error | The standard deviation of the mean provides an indication of the accuracy of a sample mean as an estimator of the population mean. Procedures such as Proc MEANS or Proc REPORT can provide this. See STDERR option. |
| Other Statistical Terms |
|
| Random | Subset of individuals (a sample) chosen from a larger set (a population). See SAS paper. title1 'Customer Satisfaction Survey'; title2 'Simple Random Sampling'; proc surveyselect data=Customers method=srs n=100 out=SampleSRS; run; |
|
|
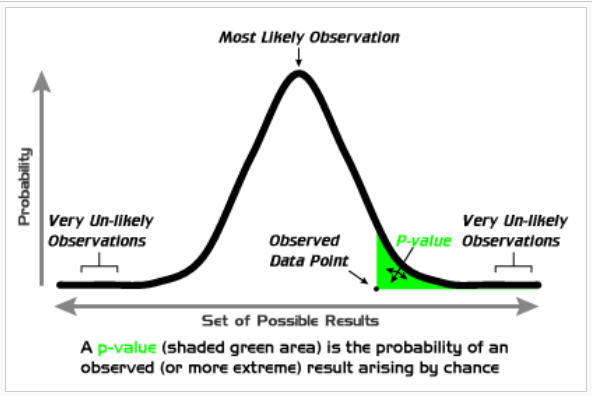
The probability of rejecting the null hypothesis when the null hypothesis is true. Inferential - The probability that the test statistic would be equal to an extreme value than that actually observed. I.E. the smallest level alpha at which the data is significant. For example, if testing value is 0.507, two-sided, with p-value of 0.37 for coin toss, then the coin toss is what is expected within 95% of the time if the coin was fair (meaning probability of heads is 0.5). We do not reject the null of 0.5 value. The smaller the p-value, the stronger the evidence against the null hypothesis. |
|
|
Relationship between two variables Add the FISHER option to PROC CORR to include confidence intervals. R-square - the coefficient of determination in a regression model, measures the proportion of variability in the response that is explained by the regressor variables. R-square statistics also play an important indirect role in regression calculations. For example, the proportion of variability explained by regressing all other variables in a model on a particular regressor can provide insights into the interrelationship among the regressors. Adjusted R-square - This is an adjustment of the R-squared that penalizes the addition of extraneous predictors to the model. Adjusted R-squared is computed using the formula 1 - ((1 - Rsq)(N - 1) /( N - k - 1)) where k is the number of predictors. See PROC REG User Guide. (Output Datasets) |
| Confidence Intervals |
Used to indicate the range of likely values for a statistic. For example, a 95% confidence interval on the mean would indicate the upper and lower bounds that you can expect to encompass the means of many samples 95% of the time. Level of confidence - 90%, 95%, 99% of the mean or proportion Forest Plots show the magnitude of benefit and confidence limits of each subgroup analyzed. Also see Forest macro for statistical plot. PROC MEANS DATA=test NOPRINT NWAYS ALPHA=.05; Proc Means, Proc Freq, Proc TTest for differences between two independent sample means, Proc GLM - General Linear Model, Proc NPar1way |
| Degrees of Freedom | These are the degrees of freedom associated with the sources of variance. The total variance has N-1 degrees of freedom. The model degrees of freedom corresponds to the number of coefficients estimated minus 1. For example, including the intercept, if there are 5 coefficients, then the model has 5-1=4 degrees of freedom. The Error degrees of freedom is the DF total minus the DF model, 199 - 4 =195. |
| Geometric Mean and Coefficient of Variation |
CV = 100 * (sample standard deviation) / sample mean |
|
Least Squares Mean |
proc glimmix; |
|
Hazards / Odds Ratio |
Hazard Ratio (HR) is the relevant risk of experiencing an event being measured (e.g. death) between two groups. HR=1 means no difference HR < 1 means there was a reduced risk in one of the treatment arms HR > 1 means an increased risk in of the treatment arms Odds Ratio (OR) is the ratio of an event happening compared to an event not happening in the sampled population. proc glimmix; * Another example; ods output "Odds Ratios"=orci; set orci; |
| Cox / Multivariate Regression |
Cox Regression model provides us with estimates of the effect that different factors event (eg. age, weight, sex, etc.) have on the time until the end. Build a multiple regression model to predict the cost of a car. PROC REG DATA = cars ; |

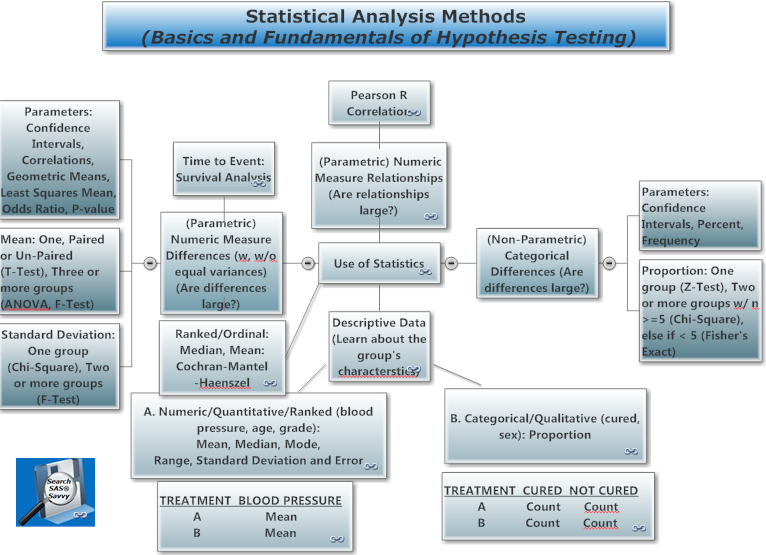
II. Which Statistical Test to apply depends on the type of data and analysis to perform
Basic Statistics, Statistics Tutorials, STAT Procedures, StatsToDo
|
Descriptive vs. Inferential |
Descriptive Statistics |
Inferential Statistics |
Inferential Statistics |
Inferential Statistics (Modeling) |
|
One, Two vs. Three or More Samples, Parametric vs. Non-Parametric, Mean/Proportion/ Standard Deviation |
Single Measurement |
Difference Between Two Measurements |
Relationship Between Two Measurements |
Difference Between Three Measurements w/wo Covariates(ANOVA) |
|
PARAMETRIC (Normal Distribution) |
|
|
|
|
|
Mean (numeric) |
T-Test (One Sample vs. Fixed value) |
T-Test (Paird, Un-Paired) |
Pearson R (Two Samples) |
F-Test (Three or more Samples) PROC ANOVA (balanced) PROC GLM (unbalanced) |
|
Proportion (category) |
Z-Test (One Sample vs. Fixed value) |
Chi-Square/ Fisher's Exact (Two Samples) |
Chi-Square/ Fisher's Exact (Two Samples with 2 levels) Cochran–Mantel–Haenszel statistics (CMH) (Two Samples with > 2 levels) |
|
|
Standard Deviation (numeric) |
Chi-Square/ Fisher's Exact (One Sample vs. Equal values) |
F-Test (Two Samples) |
|
|
|
NONPARAMETRIC (Non-Normal Distribution) |
|
|
|
|
|
Mean (numeric) |
Wilcox/Mann-Whitney U (One Sample vs. Fixed value) |
Sign Test (Two Samples) |
Spearman r (Two Samples) |
|
|
Proportion (category) |
|
Mann-Whitney U (Two Samples) PROC NPAR1WAY |
|
|
|
Standard Deviation (numeric) |
Kruskal-Wallis (One Sample vs. Fixed value) |
Kruskal-Wallis (Two Samples) |
|
|
Statistical Question - ODS Statistical Graphics |
Plot/Chart |
|---|---|
|
COMPARE PRODUCT DISTRIBUTION: Which products accounted for the largest share of total company sales? |
Pie |
|
COMPARE PRODUCT SALES: Which products were top performers based on total sales? |
Horizontal Bars |
|
COMPARE PRODUCT GROUP SALES: When comparing shoes and slipper sales, which customer had higher sales? When comparing shoes and slipper sales for selected customers, which customers had high sales? What is the relationship between sales and expense? |
Horizontal Bars
Vertical Bars Scatter Plot |
|
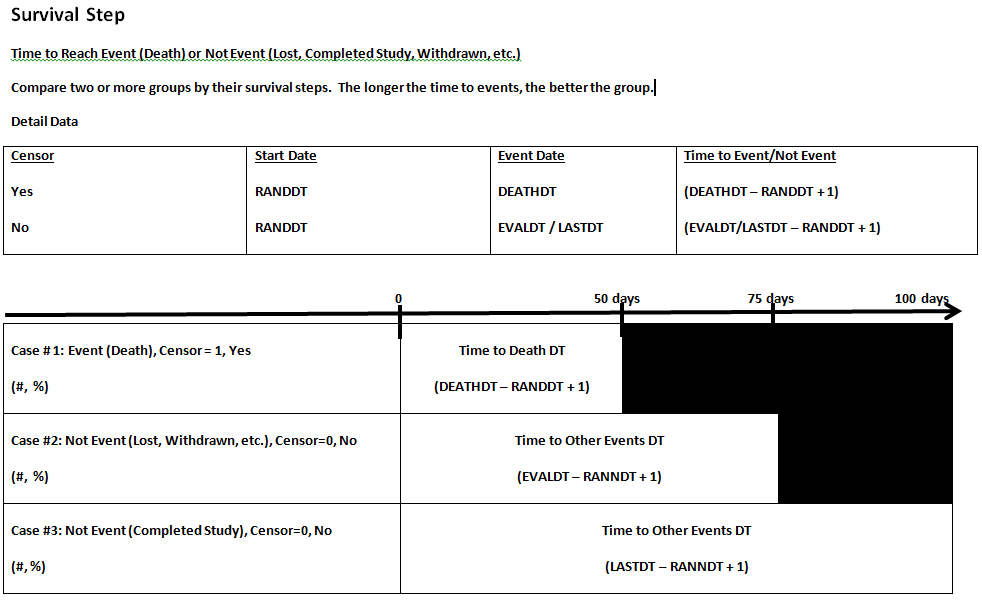
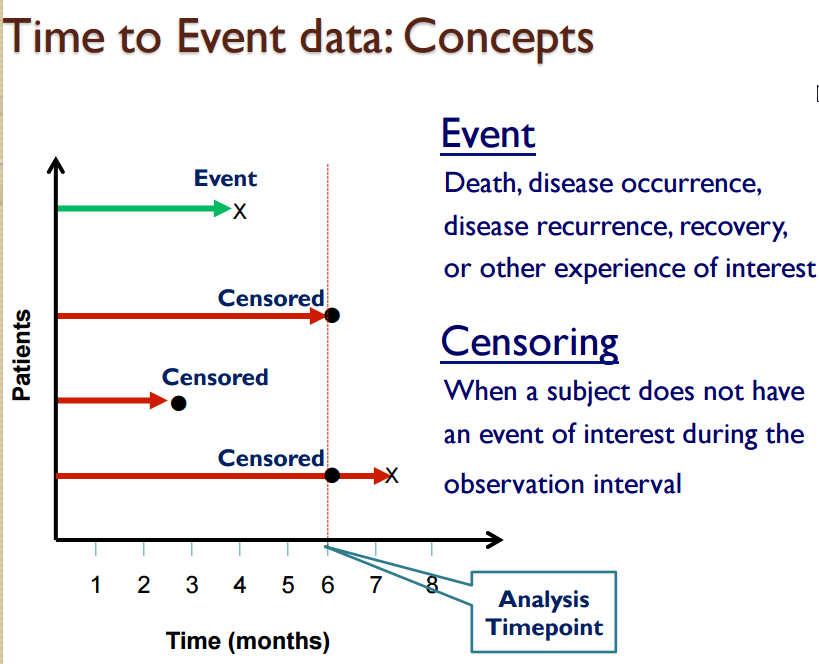
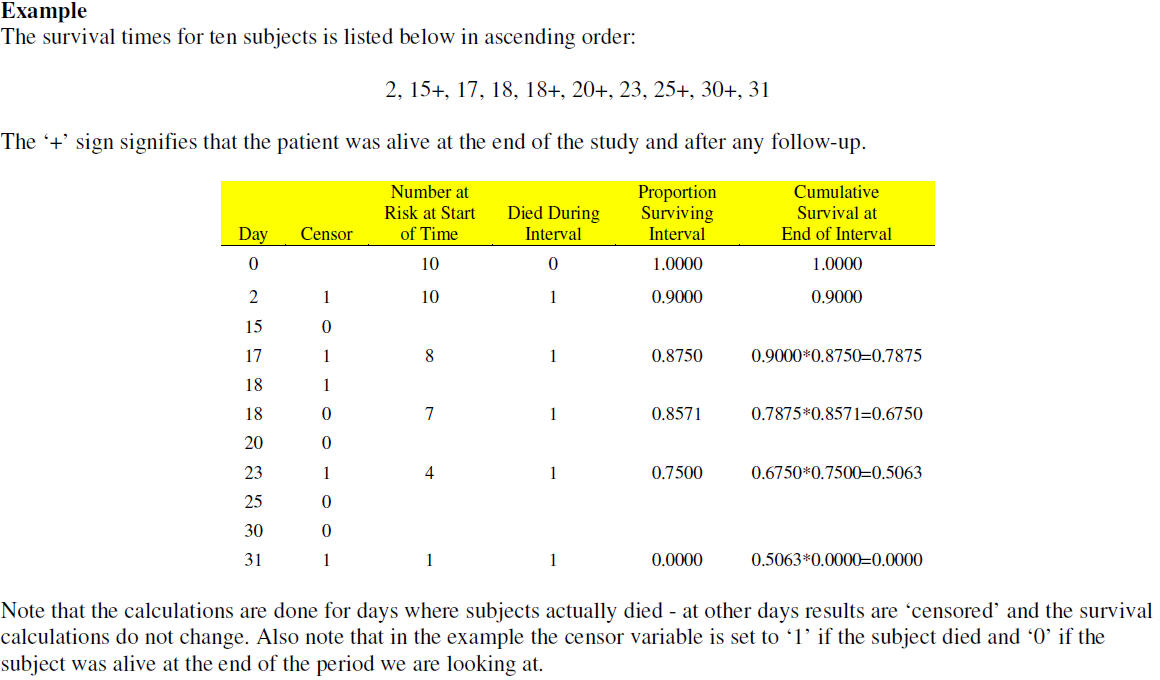
COMPARE TIME PERIODS: How much have sales risen this year? Across time, how do shoe sales compare with slipper sales? Kaplan-Meier curve is a graphical representation of a time to event analysis showing when a patient reaches a trials survival endpoint. How do survival times compare between two treatment groups - Alive/Dead/Withdrawn? In general survival analysis is based on one Event such as Death. Censor observations means that the patient did not reach the event, or is still alive and the exact failure time is unknown. If patient is still alive, then patient is censor=0. The days is based on the last follow-up date. The alternative is setting censor=1; Non-censored observations means that the patient reached the event or died. The censor=1 and the days is their death date. The alternative is setting it in reverse, censor=0; Note that it is possible to have several non-censor values to indicate different events such as 0=death, 1=completed study, 2=adverse event, 3=lost to follow-up. For each censor=1 value over time, the 100% survival from time 0 is reduced. |
Vertical Bars
Line
|
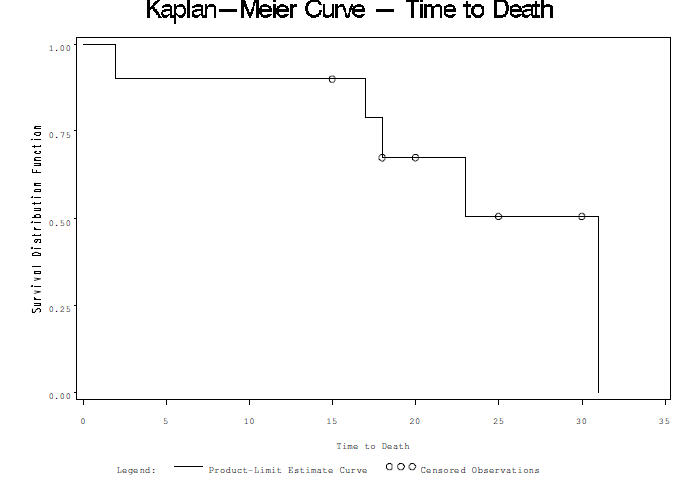
Survival Analysis and Plots See SAS paper HOW Interpretation Kaplan-Meier
Survival analysis is a method used to describe failure time data such as time to removal of hip prosthesis.
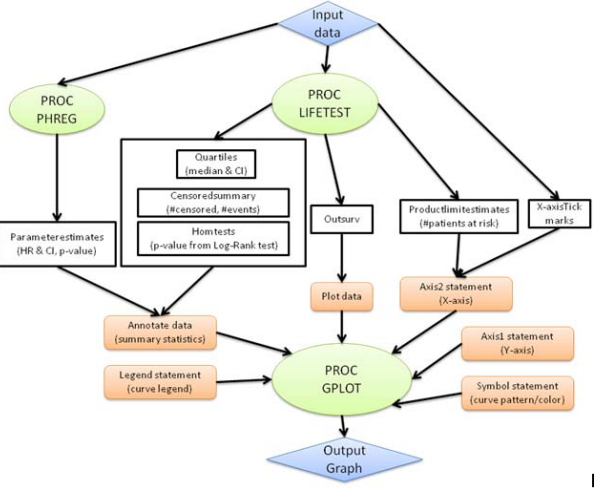
There are several options to create survival plots based on direct method for using PROC LIFETEST to create the plot or indirect method for using PROC LIFETEST to create the output dataset and use PROC GPLOT wtih the ANNO dataset to create a customized plot.
With the Graph Template Language GTL, more customization is possible. In addition PROC GREPLAY can be used to display plots side by side. Many of the advanced options are available in SAS 9.3, however, these procedures were introduced in SAS 9.2, PROC SGPLOT, PROC SGPANEL and PROC SGCATTER. See UCLA Proc LIFETEST example, Introduction to Survival Analysis in SAS, ODS Statistical Graphs, PROC LIFETEST chapter, PROC PHREG chapter, and PROC LIFETEST syntax for more info. See also lecture 1, lecture 2, or Stat Tutorials, ebook, define, lecture 3, lecture 4, and lecture 5.
Options/Syntax |
Example Layout |
| 1) Standard direct method in SAS 9.2 proc lifetest data=myeloma plots=survival; strata frac; time time*vstatus(0); run; |
 |
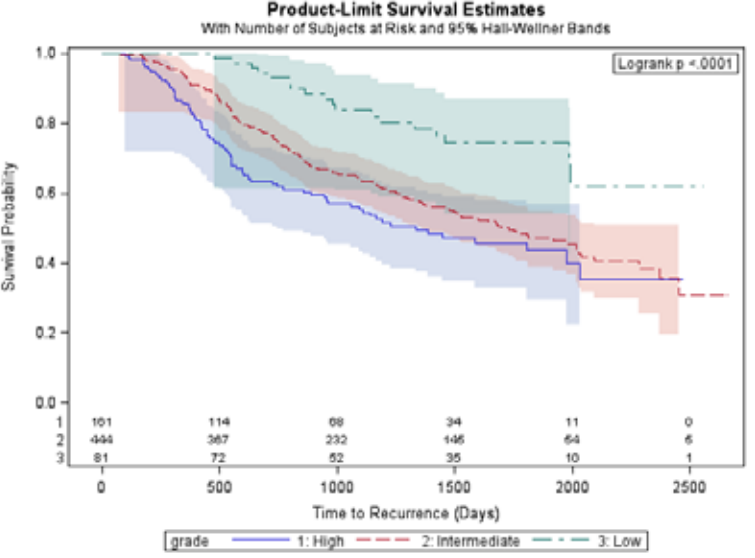
2a) Direct method to include At Risk Table within survival plot in SAS 9.2 (See SAS Paper), 2 ods graphics on; proc lifetest data = gbcs plots = survival(atrisk = 0 to 2500 by 500); time rectime*censrec(0); strata grade; run; ods graphics off; |
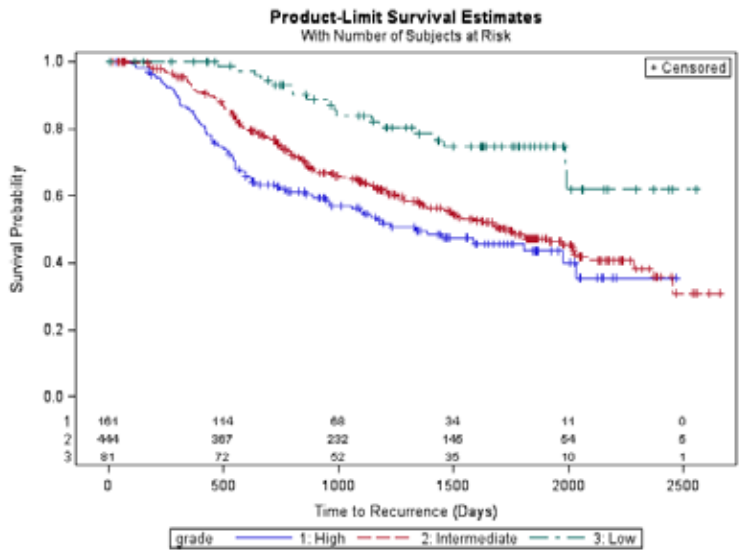 |
2b) Direct method to include At Risk Table and 95% CI band within survival plot in SAS 9.2 (See SAS Paper), 2 ods graphics on; proc lifetest data = gbcs plots = survival(atrisk = 0 to 2500 by 500 cb = hw test nocensor); time rectime*censrec(0); strata grade; format grade grd.; run; ods graphics off; |
 |
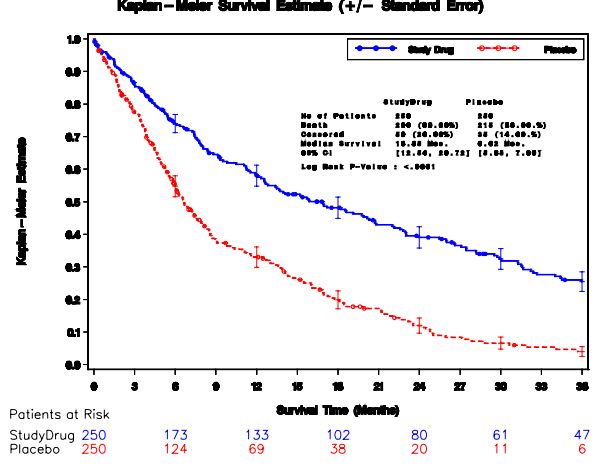
| 3) Indirect method with output dataset from PROC LIFETEST, annotate dataset for group summary or error bars, PROC GPLOT the output dataset and PROC GREPLAY to combine plots (See SAS Paper 1, 2, 3) Example 1 of Output Dataset ods output productlimitestimates=ple homtests=test quartiles=limits censoredsummary=cens; proc lifetest data=&dset; time tmtoevnt*event(0); strata trtan; run; Example 2 of Output Dataset ods output homtests=homeT; proc lifetest data=hmohiv outsurv= LTEstimates; time time*censor(0); strata drug; run; goptions reset=all; * Simple example; proc gplot data= ple annotate=anno; plot survival * time = drug; run; quit; * Multiple lines example; proc gplot data=ple annotate=anno; plot (survival0 survival1) * time/overlay haxis=axis1 vaxis=axis2 hminor=0 vminor=1 nolegend; run; |
 |
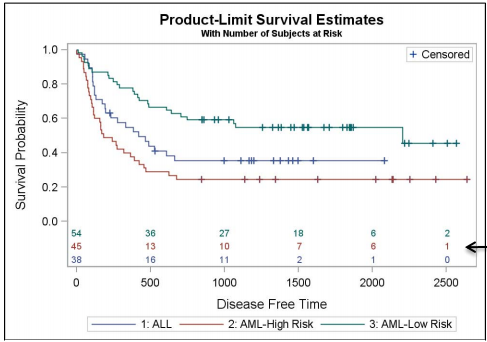
4) Indirect method with PROC LIFETEST and PROC SGPLOT in SAS 9.3. title 'Product-Limit Survival Estimates'; title2 h=7pt 'With Number of Subjects at Risk'; ods survivalplot=SurvivalPlot49_2_1; proc lifetest data=BMT plots=survival(atrisk=0 to 2500 by 500); strata group / test=logrank adjust=sidak; run; ods close; proc sgplot data=SurvivalPlot49_2_1; step x=time y=survival / group=stratum name='survival'; scatter x=time y=censored / markerattrs=(symbol=plus) name='censored'; scatter x=time y=censored / group=stratum markerattrs= (symbol=plus); scatter x=tatrisk y=stratumnum / markerchar=atrisk y2axis group=stratumnum; keylegend 'survival'; keylegend 'censored' / location=inside position=topright; yaxis offsetmin=0.2 min=0; y2axis offsetmax=0.85 display=none min=1 max=3; run; |
 |
1. Analysis of Survival Data with Recurrent Events Using SAS, Rena Jie Sun, Daniel
Cotton
2. Customizing Survival Plots by Example Nan Liu, Marcelo Coca-Perraillon
3. IMPROVEMENTS TO A SURVIVAL PLOT, Young Kim
4. Survival 101 - Just Learning to Survive, Leanne Goldstein, Rebecca Ottesen
5. Enhancement of Survival Graph, Joanne Zhou
6. Creating and Customizing the Kaplan-Meier Survival Plot in PROC LIFETEST
Warren F. Kuhfeld, Ying So
8. Time to Event Analysis in the Pharmaceutical and Medical Device Industries, Helen M. Chmiel, Evan Ritzema [PROC LIFTEST]
9. PERFORM SURVIVAL ANALYSIS FOR CLINICAL TRIALS USING ODS, Wei Cheng [Sample Dataset]
10. Data Annotations in Clinical Trial Graphs, Sudhir Singh
11. Customizing Survival Plot by %Survivalplot Macro, Zhong Yan
12. A Step-by-Step Guide to Survival Analysis, Lida Gharibvand
13. An Introduction to ODS for Statistical Graphics in SAS 9.1, Robert Rodriguez
14. Getting Started with ODS Statistical Graphics in SAS® 9.2—Revised 2009 Robert N. Rodriguez
15. An Overview of ODS Statistical Graphics in SAS® 9.3, Robert Rodriguez
17. PROC LIFEREG or PROC PHREG, Dachao Liu
18. Creating Macros for Survival Data in Oncology Study, Jagannath Ghosh
19. 7 Steps to Progression Free Survival Insights Using SAS, Karen Walker [Oncology]
20. Kaplan-Meier Survival Plotting Macro %NEWSURV, Jeffrey Meyers [%NEWSURV]
21. A Set of SAS® Macros for Generating Survival Analysis Reports for Lifetime Data with or without Competing Risks, Zhen-Huan Hu [Relapse]
Kaplan-Meier is same as Product-Limit, Method=ACT for Actuarial estimates
| Event (Death due to treatment only) |
Censor (Yes, if the subject did not reach event) |
# of Days since Randomization Date (Date which survival is based on) |
| 0 Alive, Completed Study | 1 (Yes, event not reached) | Study Completion Date |
| 0 Alive, Not Completed Study | 1 (Yes, event not reached) | Last follow-up date |
| 0 Withdrawn | 1 (Yes, event, not reached) | Withdrawal date |
| 1 Died | 0 (No, event reached) | Death date |
Event - the “event”, such as death due to treatment only, occurred during the study at a particular timepoint for a subject. Generally, CENSOR=0 for these patients. Other events will have censor=1.
Censor - mathematically removing a subject from the curve at the end of their time on the study if the subject did not have an event, such as death, this means that patients who are lost to followup or completed the study are considered censored. Generally, CENSOR=1 for these patients. The exact failure time is not known for these patients.
Missing Values and Outliers Paper Data Quality Review for Missing Values and Outliers
Ying Guo, Bradford Danner, See also Lab Data Processing for examples of LOCF and PROC CALIS.
ODS Paper Using Procedure-Based ODS Data Components in Statistical Reporting, Vincent J. Faber
SAS Presentation Impact of Analytics in Daily Life, YouTube, Eight Levels
SAS Institute Papers and Presentations
Beginner SAS Programmer |
Statistical Analysis – The First Steps, Jennifer Waller [HOW]
1. Answering Your Questions with Statistics, Diana Suhr
3. Data Presentation 101: An Analyst’s Perspective, Deanna Chyn, Anca Tilea [PROC REG, PROC MEANS, PROC BOXPLOT, PROC SGPLOT]
5. Data: Getting to Know You, Getting to Know All about You, Larry and Sue Douglass [PROC UNIVARIATE, PROC FREQ]
6. Simple Tests of Hypotheses for the Non-statistician: What They Are and Why They Can Go Bad, Art Carpenter [PROC TTEST, PROC UNIVARIATE]
7. How MEAN is T-test?, Naina Pandurangi [PROC TTEST, PROC MEANS]
8. A Day in the Life of Data – Part 4, Sanjay Matange
Advanced SAS Programmer |
1. The Steps to Follow in a Multiple Regression Analysis, Theresa Hoang Diem Ngo [HOW, PROC REG, PROC RSQUARE, PROC GLM, PROC TRANSREG, PROC CORR]
2. Logistic Regression Basics, Joseph Guido, Paul Winters, Adam Rains [PROC REG, PROC LOGISTIC]
3. PROC MIXED: Underlying Ideas with Examples, David Dickey [PROC MIXED]
4. AUTOMATED SAS® MACRO FOR ADVERSE EVENT LOGISTIC REGRESSION ANALYSIS, Suhas Sanjee, Sheng Zhang
5. Introducing the GLIMMIX Procedure for Generalized Linear Mixed Models, Oliver Schabenberger
Macro SAS Programmer |
1. SAS Macros for Working Statistician, William Krebs
2. Want to Do a Better Job? - Select Appropriate Statistical Analysis in Healthcare Research, Liping Huang [Macros]
2. The Evolution of Linear Models in SAS: A Personal Perspective, Ramon Littell [Compare PROC GLM, PROC REG, PROC MIXED]
3. Comparison of Enterprise Miner and SAS/Stat for Data Mining, Patricia B. Cerrito
4. Calculating Questionnaire Score Made Easy in SAS, Qin Lin
5. Missing by Design: Questionnaire Skip Logic, Kathryn Valdés
7. MISSING! - Understanding and Making the Most of Missing Data, Suzanne M. Humphreys
9. On Deck: SAS/STAT® 9.3, Maura Stokes, Fang Chen, and Ying So
10. Current Directions in SAS/STAT® Software Development, Maura Stokes
11. Analyzing Ordinal Repeated Measures Data Using SAS®, Bin Yang
12. Adding (p-) Value to Tables – a Programmer’s Perspective, Kathryn Wright
13. Analysis of a Binary Outcome Variable Using the FREQ and the LOGISTIC Procedures, Arthur X. Li
14. U.S. Health and Nutrition: SAS® Survey Procedures and NHANES, Jeff Gossett, Chan-Hee Jo, Pippa Simpson [unadjusted, adjusted means]
16. Wait Wait, Don't Tell Me… You're Using the Wrong Proc!, David Cassell
17. Clinical Study Report Review: Statistician’s Approach, Amita Dalvi [Checklist]
20. Using PROC RANK and PROC UNIVARIATE to Rank or Decile Variables, Jonas Bilenas
21. Tips and Tricks for Clinical Graphs using ODS Graphics, Sanjay Matange
22. Using Procedure-Based ODS Data Components in Statistical Reporting, Vincent Faber [Output Objects]
24. How to Display Correlated ROC Curves with the SAS System, Barbara Schneider
25. Receiver Operating Characteristic (ROC) Curves, Mithat Gönen
27. PROC SURVEY… Says!: Selecting and Analyzing Stratified Samples, Darryl Putnam
28. Selecting a Stratified Sample with PROC SURVEYSELECT, Diana Suhr
31. Efficient Statistical Programming? - Let SAS Do the Work, Keiko I. Powers
32. Using PROC STANDARD and PROC SCORE to impute missing multivariate values, Paul A. Montagna [Proc Standard Syntax] [Example]
33. Imputing Missing Data using SAS, Christopher Yim
34. Multiple Imputation: Better than Single Imputation in Pain Studies?, Ashik Chowdhury
35. A SAS® Macro for Single Imputation, Shuping Zhang, Jane Liao and Xingshu Zhu [Practical Example]
36. Biomarker as essential part of clinical development Renuka Chinthapally
37. Visualize Missing Data Blog
38. Missing Values, They Are NOT Nothing, Justin Jia, Amanda Lin
39. A macro for nearest neighbor imputation, Lung-Chang Chien, Mark Weaver [Impute]
40. Data Visualization of Outliers from a Health Research Perspective
41. Data Quality Review for Missing Values and Outliers Ying Guo, Bradford Danner [Macro]
42. CHEKOUT: A SAS® Program to Screen for Outliers, James Handsfield
43. Data cleaning and spotting outliers with UNIVARIATE, Michael Auld
44. A SAS® Application to Identify and Evaluate Outliers, Richard Hendra, Paulette Staum
45. Imputing Missing Data using SAS, Christopher Yim
46. A SAS® Macro for Single Imputation Shuping Zhang, Jane Liao and Xingshu Zhu
47. Hot-Deck Imputation: A Simple DATA Step Approach, Lawrence Altmayer
48. Missing Data? A Look at Two Imputation Methods, Anita Rocha
49. An Alternative to PROC MI for Large Samples, David Lanning, Doug Berry
50. MISSING VALUES: Everything You Ever Wanted to Know, Malachy Foley
51. Missing Values in SAS, Magnus Mengelbier
52. Special Missing Values for Character Fields, John Ladds
53. What You’re Missing About Missing Values, Christopher Bost
55. Descriptive Summary Table Made Easy, Murshed Siddick, Rafi Rahi
56. Statistical Methods in Diagnostic Medicine using SAS® Software, Jay Mandrekar, Sumithra Mandrekar
59. MINING YOUR DATA FOR HEALTH CARE QUALITY IMPROVEMENT, Greg Rogers, Ellen Joyner
61. Using PROC SURVEYSELECT: Random Sampling, Raissa Kouadjo Bordenave
62. The Missing Link: Data Analysis with Missing Information, Venita DePuy
63. Blind Data Review in Clinical Trials
64. Step Up Your Statistical Practice with Today’s SAS/STAT ® Software
65. Creating Macros for Survival Data in Oncology Study Jagannath Ghosh
67. A SAS® Macro for Adaptive Regression Modeling, George Knafl
68. Adaptive Trials and the Impact on STDM Trial Design Model, Thomas Clinch, Nate Freimark
69. Implementation of Trial Design Model (TDM) in Adaptive Design Clinical Trials, Song Gao
70. Data Challenges in Adaptive Trials, Claudio Garutti
71. ICON Adaptive Clinical Trials
See SAS Savvy presentation on To Impute or Not Impute Average or Non-Missing Values
75. Statistical Methods in Diagnostic Medicine using SAS® Software, Jay Mandrekar, Sumithra Mandrekar
76. A Regression Primer with a Touch of SAS, Vincent Maffei [Proc Reg]
77. Getting Correct Results from PROC REG, Nathaniel Derby
78. Package, Archive, Report and Test Statistical Models Using ODS, Ted Clay
83. Scrambling of Un-Blinded Data without ‘Scrambling Data Integrity’!, Jaya Baviskar


Exploratory Data Analysis (EDA)
| SAS Procedures and Methods |
| 1. PROC FREQ or PROC UNIVARIATE - Each individual variable frequency or descriptive stats and distribution |
| 2. Data Transformations such as LOG base 2 |
| 3. Bivariate or Multivariate Plot - Two or more variables are correlated indicating possible cause and effect |
| 4. Adjust for co-variates |
2. EXPLORATORY DATA ANALYSIS: GETTING TO KNOW YOUR DATA, Michael Walega
3. Exploratory or Confirmatory Factor Analysis?, Diana Suhr
4. Principal Component Analysis vs. Exploratory Factor Analysis, Diana Suhr
PROC LOGISTIC (YouTube Example) (UCLA Example)
|
Principles for
PROC LOGISTIC DATA=DSN PLOTS (ONLY)=(EFFECT ODDSRATIO (TYPE=HORIZONTALSTAT)) DESCENDING;
CLASS INDEPVAR2 (PARAM=REF REF="<VALUE>");
MODEL DEPVAR (EVENT="1") = INDEPVAR1 INDEPVAR2 INDEPVAR1*INDEPVAR2 / CLODDS=BOTH AGGREGATE SCALE=NONE LACKFIT;
UNIT INDEPVAR1 = <VALUE>;
RUN;
|
|---|
1. Predict Yes (1) or No (0) dependent variable response such as customer will buy or not buy product based on changes by units of independent variables. Analysis will determine the probability to 'acquire the event of interest'. Multiple regression technique is used to predict the value of a continuous variable. |
2. Results are displayed as plot from 0, No response to 1, Yes response. |
3. Independent variables can be categorical or continuous. Multiple Logistic Regression happens with multiple independent variables. Interaction term is added for multiple independent variables. These can be first-order, second-order, interaction terms or dummy variables. |
4. Estimates are based on odds ratio. |
5. Similar to PROC REG and PROC GLM, but PROC LOGISTIC is more appropriate for binary response. PROC GLM uses least square to fit general linear models. PROC REG is used for regression analysis. Linear regression is defined as a linear relationship between two continuous variables. |
6. UNITS INDEPVAR1 = # to display estimates at meaningful points. |
7. Prepare input dataset set needed. |
8. Options to subset selection of independent variables are: FORWARD SELECTION, BACKWARD ELIMINATION and FORWARD STEPWISE. Other options include LACKFIT, RSQUARE, and CTABLE. |
9. Calculate Sensitivity = TRUE POS / (TRUE POS + FALSE NEG) |
10. Calculate Specificity= TRUE NEG / (TRUE NEG + FALSE POS) |
11. CLASS statement enables categorical independent variables. Reference is the lowest value. |
1. A Tutorial on Logistic Regression, Ying So
2. A Tutorial on PROC LOGISTIC, Arthur Li
3. Getting Started with Proc Logistic [Presentation]
4. Fit a Logistic Regression Model With SAS [Videos]
5. GETTING STARTED WITH PROC LOGISTIC, Andrew Karp
6. Old versus New: A Comparison of PROC LOGISTIC and PROC GLIMMIX, Rebecca Christofferson
Clinical Trials (Longitudinal studies) See New Clinical Programmer for SAP example

1. Statistics for Clinical Trial SAS Programmers 1: paired t-test, Kevin Lee
2. Data Mining and Statistics in a pharmaceutical environment, Franky De Cooman
3. Data Annotations in Clinical Trial Graphs, Sudhir Singh
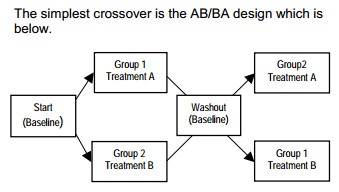
6. CROSS CROSSOVER STUDIES OFF YOUR LIST, Pippa Simpson, Robert Hamer, Shelly Lensing
7. SAS APPLICATION IN 2 * 2 CROSSOVER CLINICAL TRIAL, Wuwei Wayne Feng, Dong Ding
8. Assigning Treatment Group in Cross-over Studies: A Practical Approach, Charles Ling, Shulin Yuan
9. Like Wine, the TTEST Procedure Improves with Age, John Castelloe, Randy Tobias
10. Counting the Number of Episodes of a Given Disease From Diary Datasets, Jose F Diaz [Diary]
11. SLEEPLESS IN SEATTLE - FOR HOW MANY CONSECUTIVE NIGHTS?, Fikret Karahoda and Eric Qi [Diary]
Psychometrics Studies (Questionnaire) See also CDISC for Questionnaire SDTMs, Arrays & Do Loops
(Definition) (Definition 2) (Presentation) CRO Case Studies
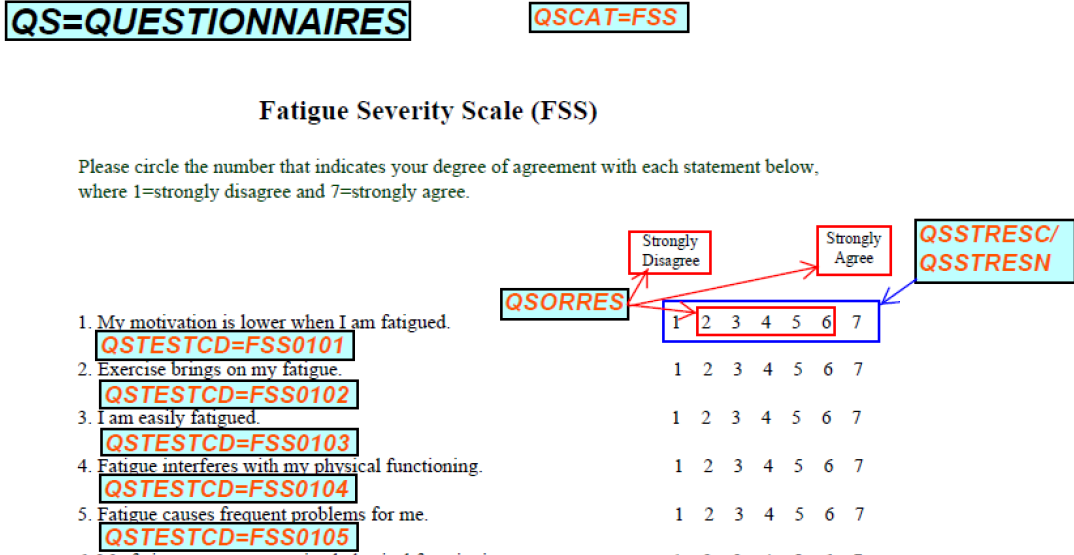
Questionnaire Assessments
Center for Epidemilogic Studies Depression Scale (CES-D)
7-item Generalized Anxiety Disorder Scale (GAD-7)
Oswestry Disability Index version 2.1a (ODI)
Short Form McGill Pain Questionnaire (SF-MPQ-2)
1. Psychometrics 101, Ron Cody
2. Psychometrics 101: Test Development, Barbara Foster
3. Are You in Need of Validation? Psychometric Evaluation of Questionnaires Using SAS®, Eric Elkin
4. Simplifying Psychometrics with SAS®, Charles A. DePascale, Jennifer L. Dunn
5. PSYCHOMETRIC AND SAS® PROGRAMMING ASPECTS OF OBJECTIVE EXAMINATIONS, W. J. Klein, G. R. Emslie
6. New Developments in Psychometric and Market Research Procedures, Warren F. Kuhfeld, Forrest W. Young
Examples of Irritable Bowel Syndrome (IBS) - Presentation, Study One, Study Two, SAS Paper
1. Multiple Techniques for Scoring Quality of Life Questionnaires, Brandon Welch, Seungshin Rhee
2. A SAS Application for Analyzing Quality of Life data: NCIC-CTG Standard Method, Don Li
4. Formats in another format, Bettina Nielsen
Translational / Experimental Medicine (Spotfire Videos) CheetSheets
1. Moving from Full Development to Translational Medecine, Nassim Sleiman
2. TIBCO Spotfire® Platform for Clinical and Translational Medicine Gerard Conway
3. Smart Statistical Graphics – A Comparison Between SAS ® and TIBCO Spotfire In Data Visualization, Yi Gu [How-To]
6. Clinical Data Visualization using TIBCO Spotfire and SAS, Ajay Gupta
7. Interactive Safety Graphics: Starting with Hepatotoxicity [Presentation]
8. Spotfire in Clinical Development [Presentation]
9. Spotfire® Clinical Visualizations from SAS and R, Zeqing Lu, hillary Graham, Jessica Chen
10. Medical Data Review Exploratory Drug Development [Presentation]
Free Statistical Tools on the WEB Study Design 101 The R Inferno e-book Statistical Review Blog
Applied Statistics and the SAS Programming Language Code, Ron Cody